100% local  ·  no telemetry

Your microservices.
Finally under control.

Orchestrio is the native desktop control center for modern engineers — manage Spring Boot services, visualize call flows, route traffic between environments, and let AI triage your logs. All in one place. All on your machine.
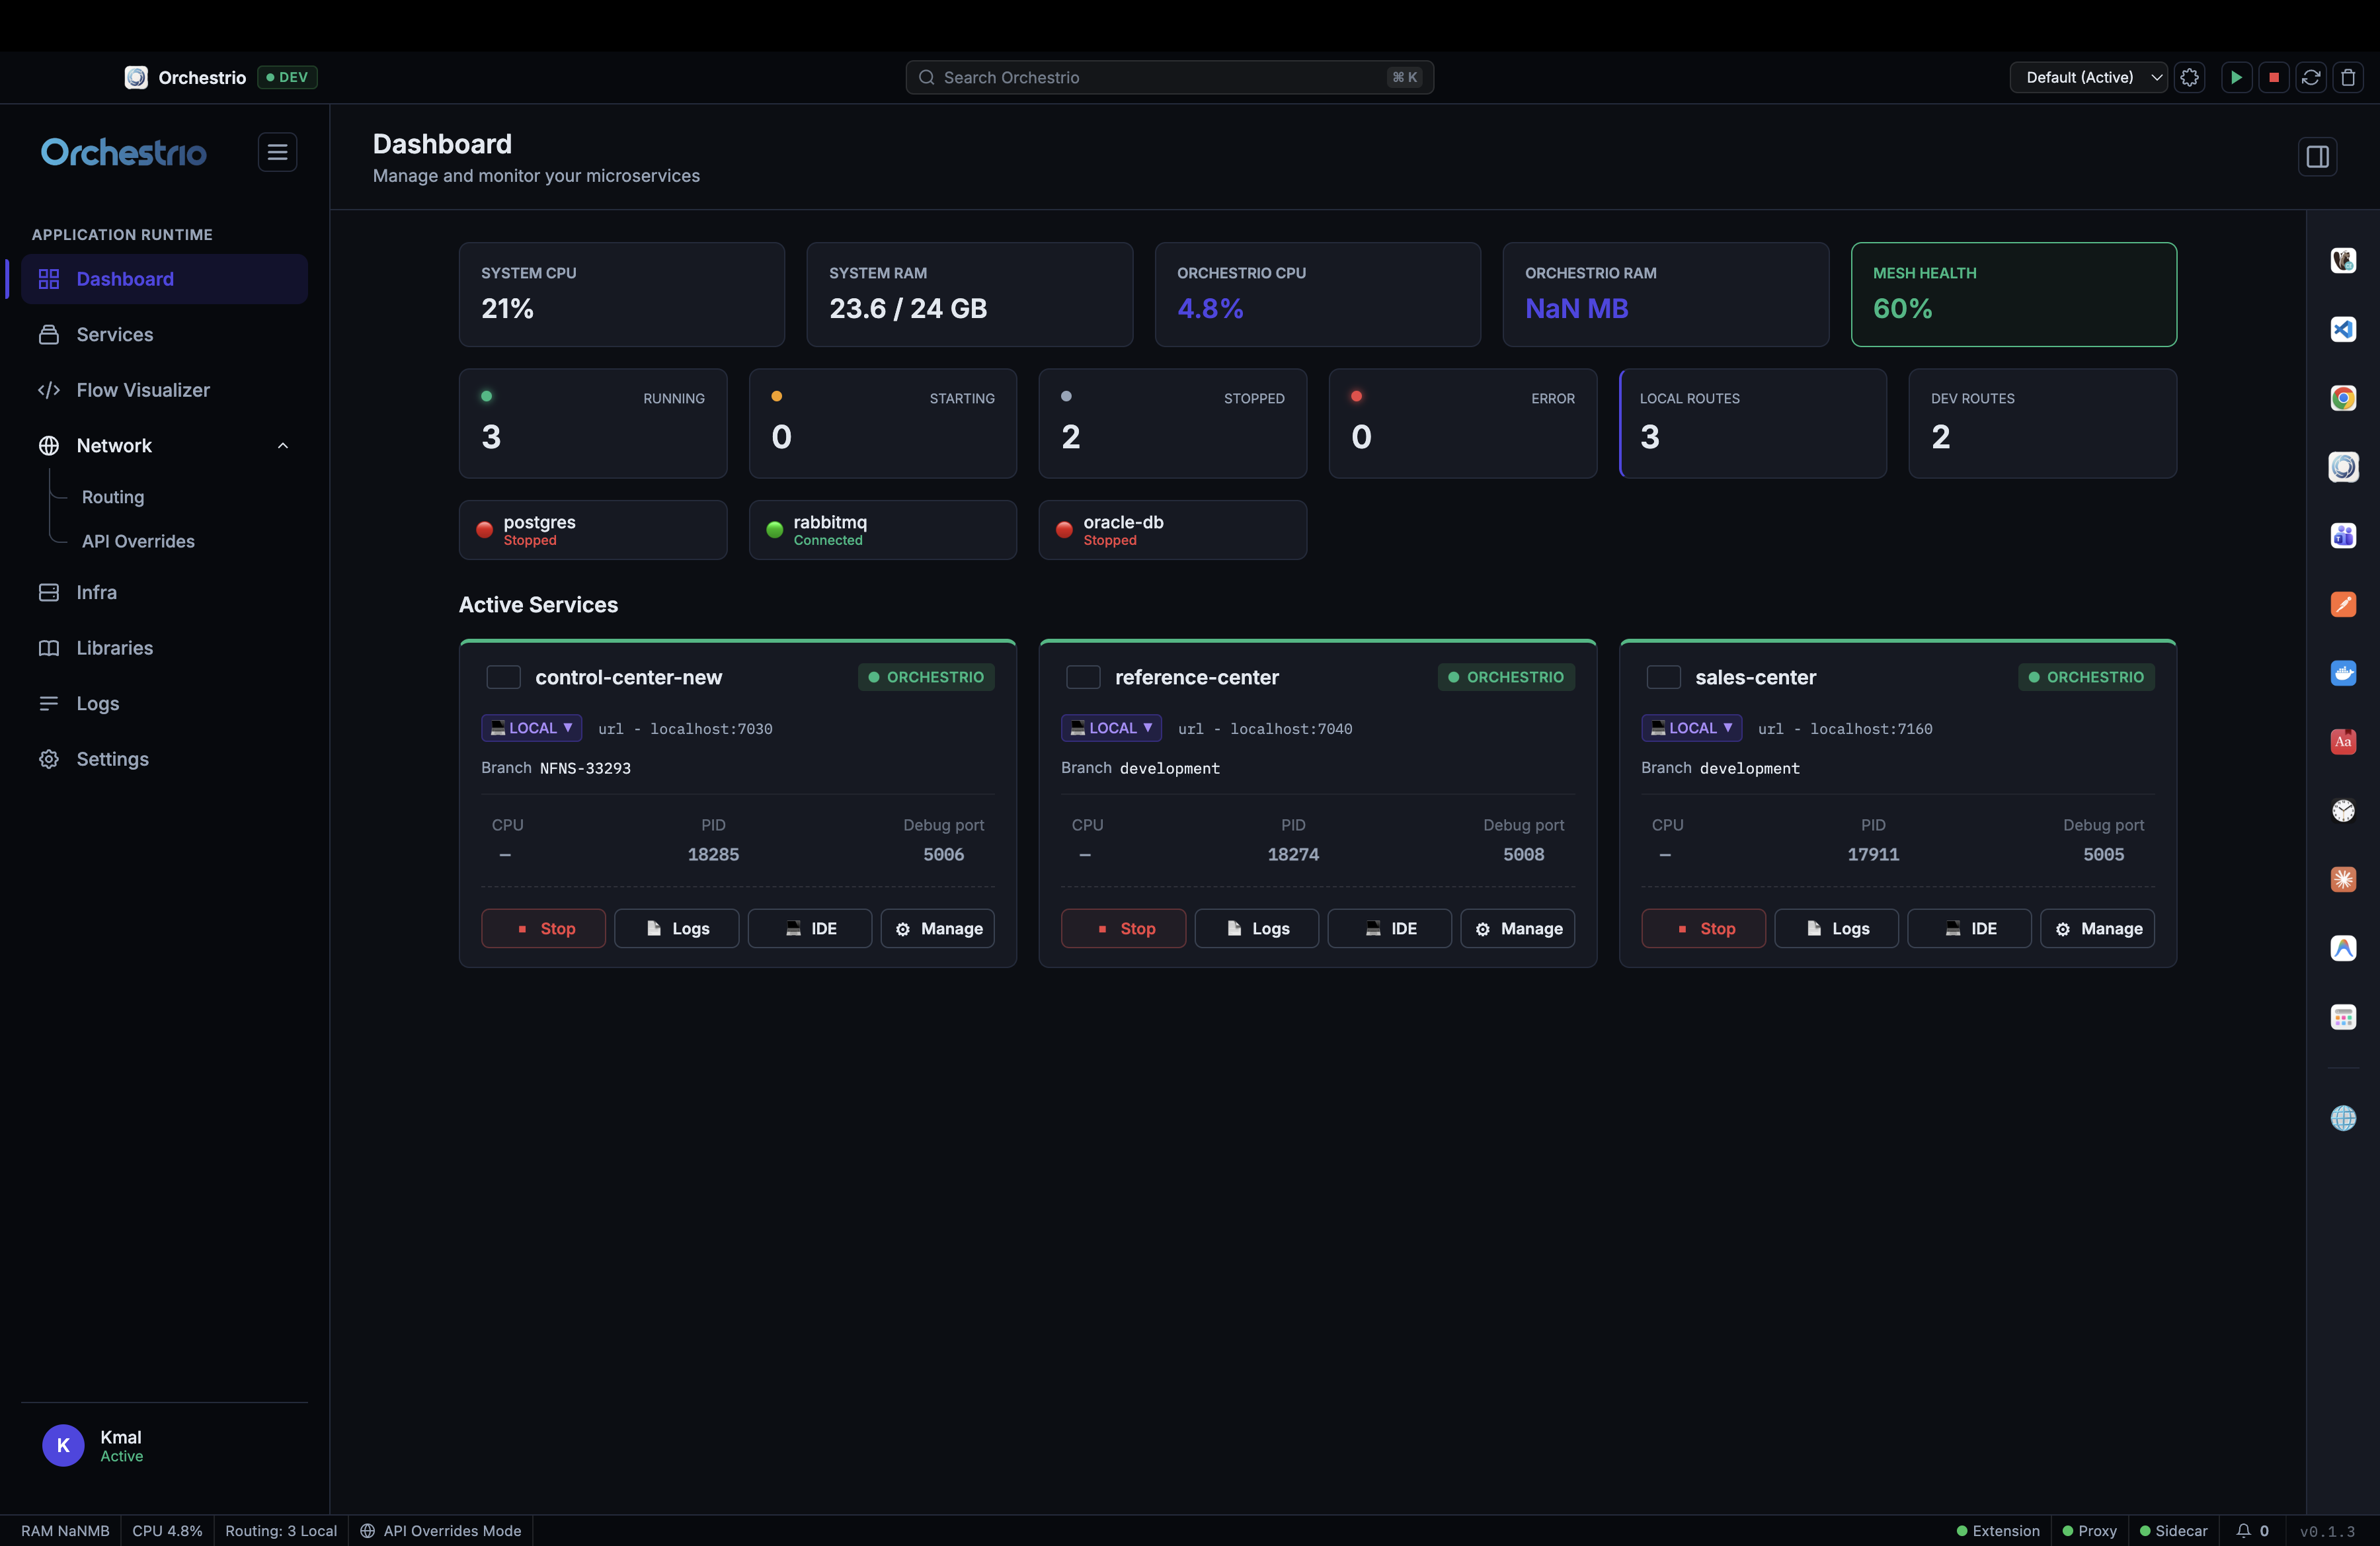
Orchestrio Dashboard showing system metrics, active services and infrastructure status
15+
Services managed simultaneously
0
Cloud accounts required
4
Environments — Local, DEV, QA, UAT
3
Components — UI, Sidecar & Extension
1
Dashboard to rule them all
The problem

15 terminal tabs.
0 idea which one crashed.

Local microservice development should not mean juggling a dozen terminal windows, manually editing YAML files, and praying the port is not in use. Orchestrio replaces the chaos with a single intelligent dashboard.

01 · Services

Start, Stop, Inspect.
Every service, one panel.

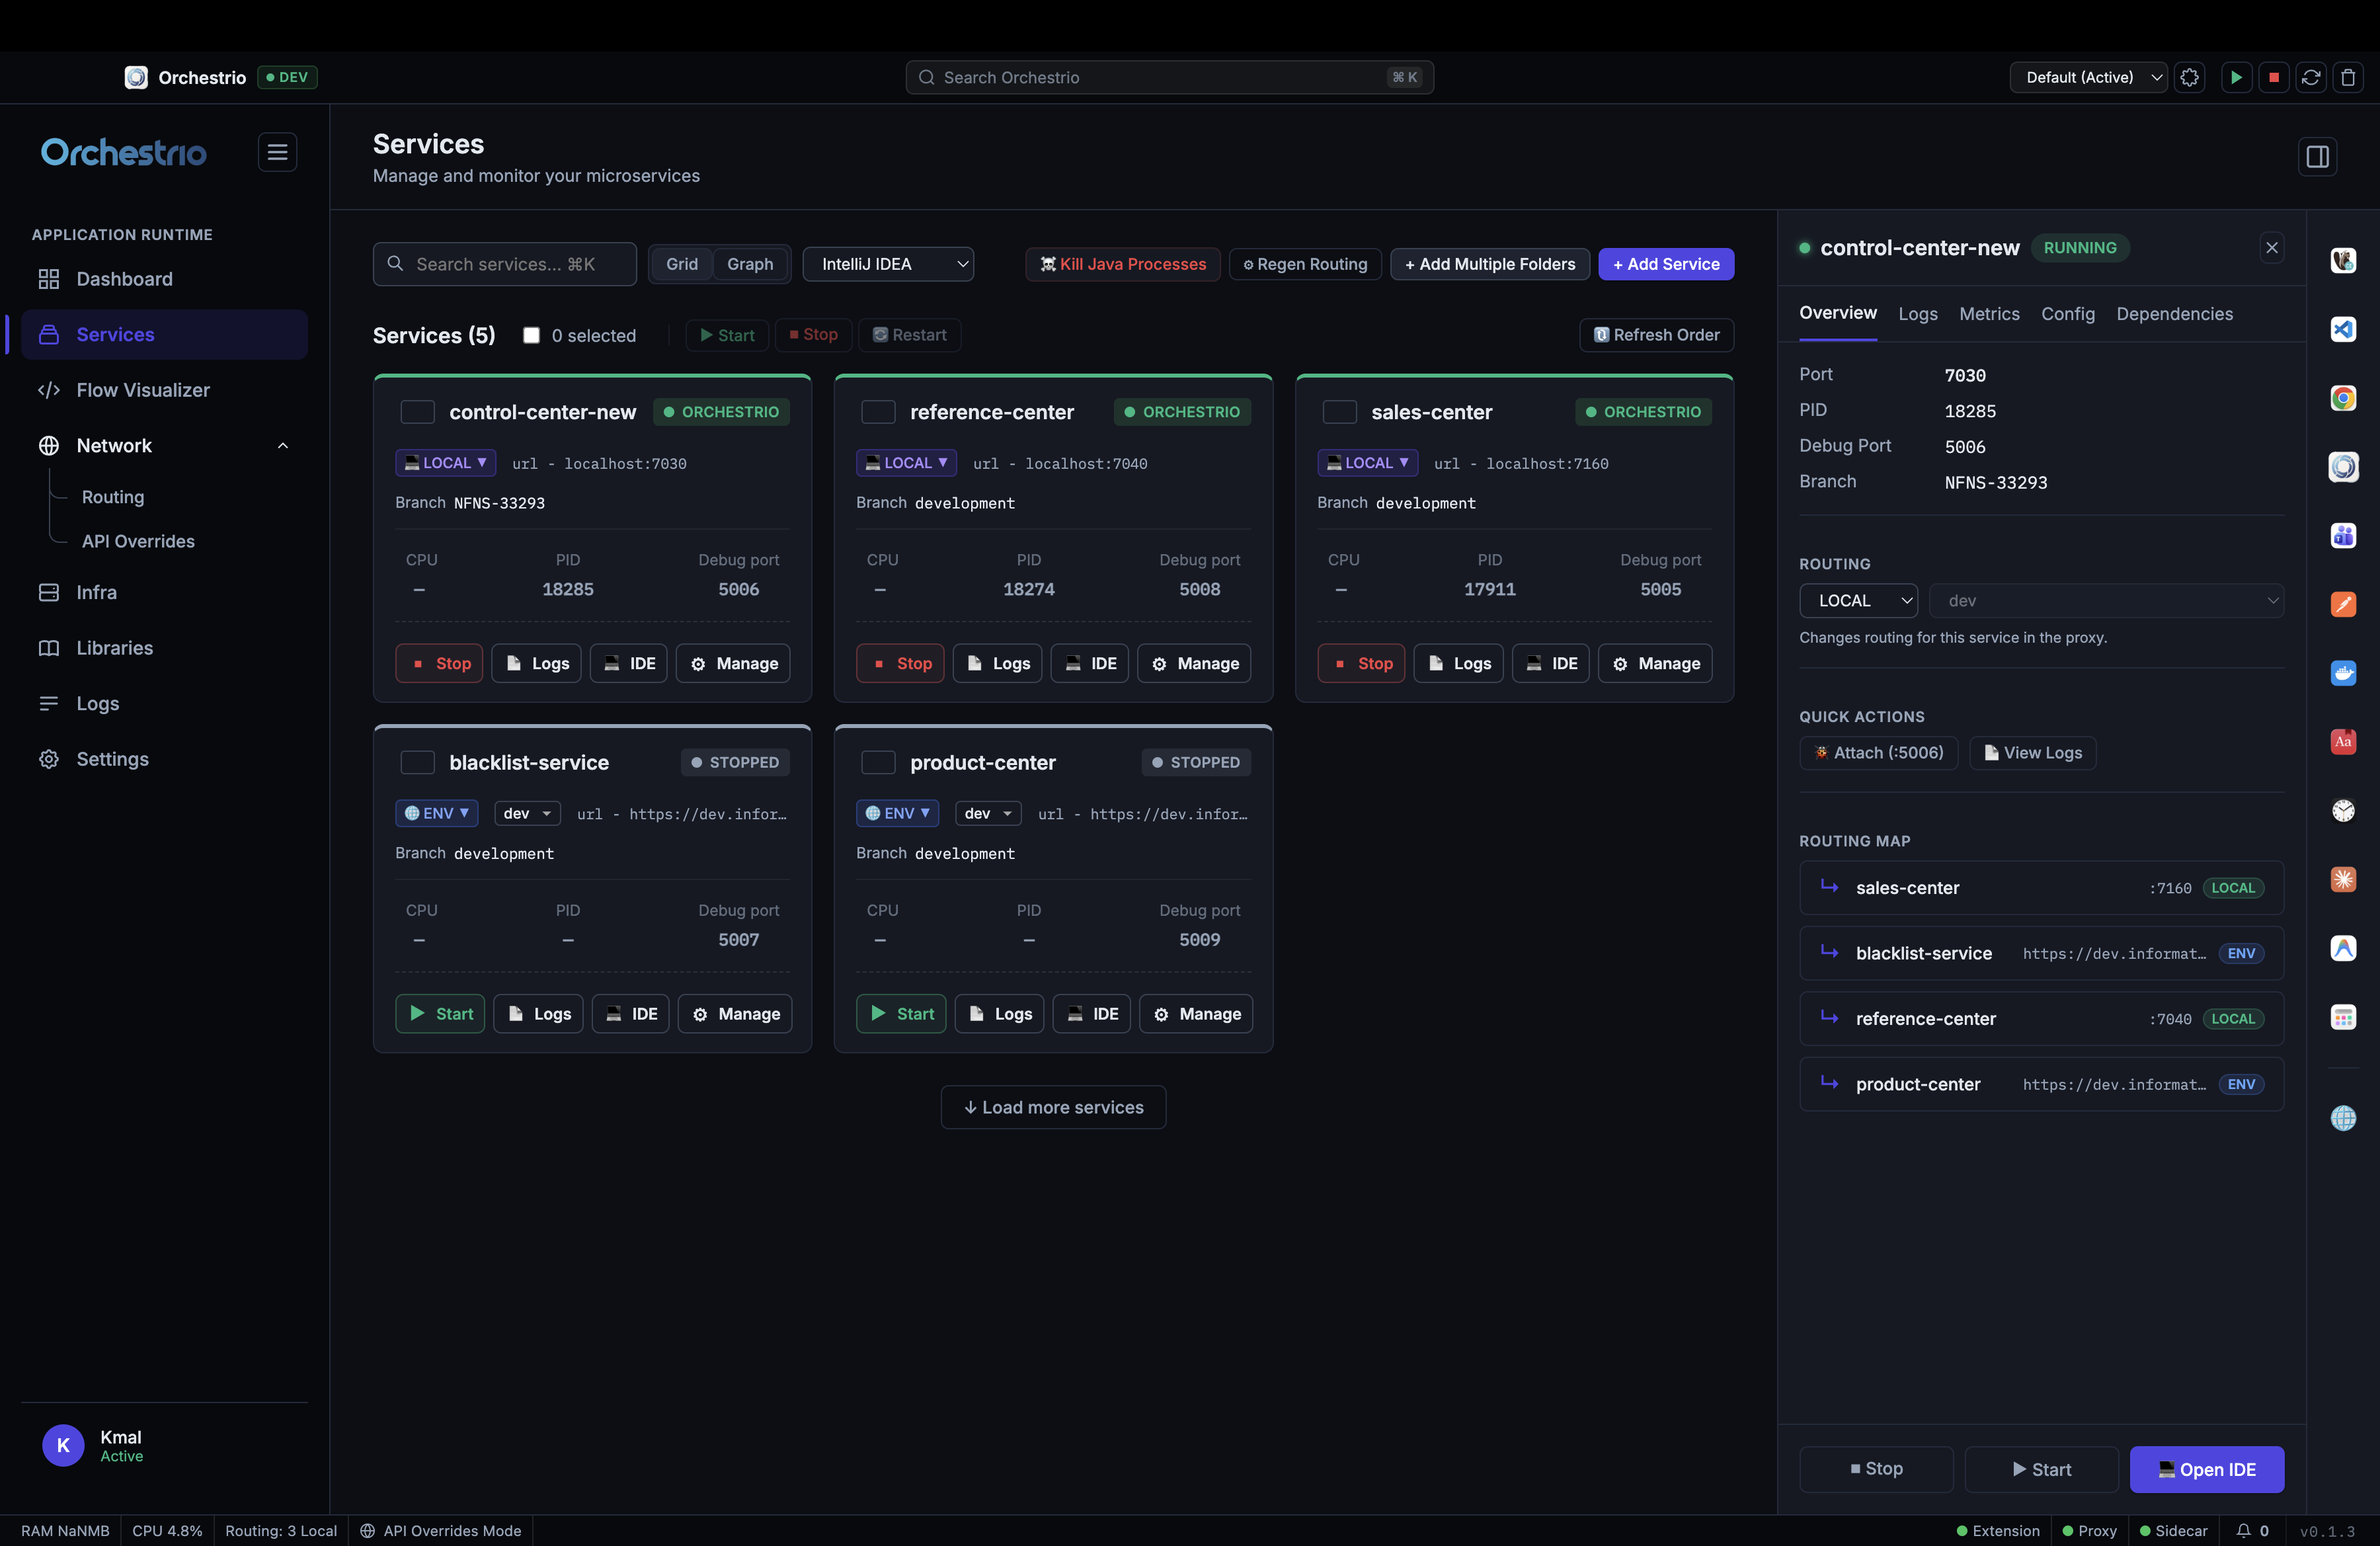
See all your Spring Boot microservices at a glance. Running, stopped, starting — with live CPU, PID, debug port, branch, and URL. Click any card to open a full detail panel with logs, metrics, config, and dependency info. Bulk start or stop with checkboxes.

Grid & Graph view Branch awareness Bulk start / stop IntelliJ IDEA integration Debug port tracking
Services grid with detail panel showing port, PID, routing environment and quick actions
02 · Network Routing

Route any service
to any environment. One click.

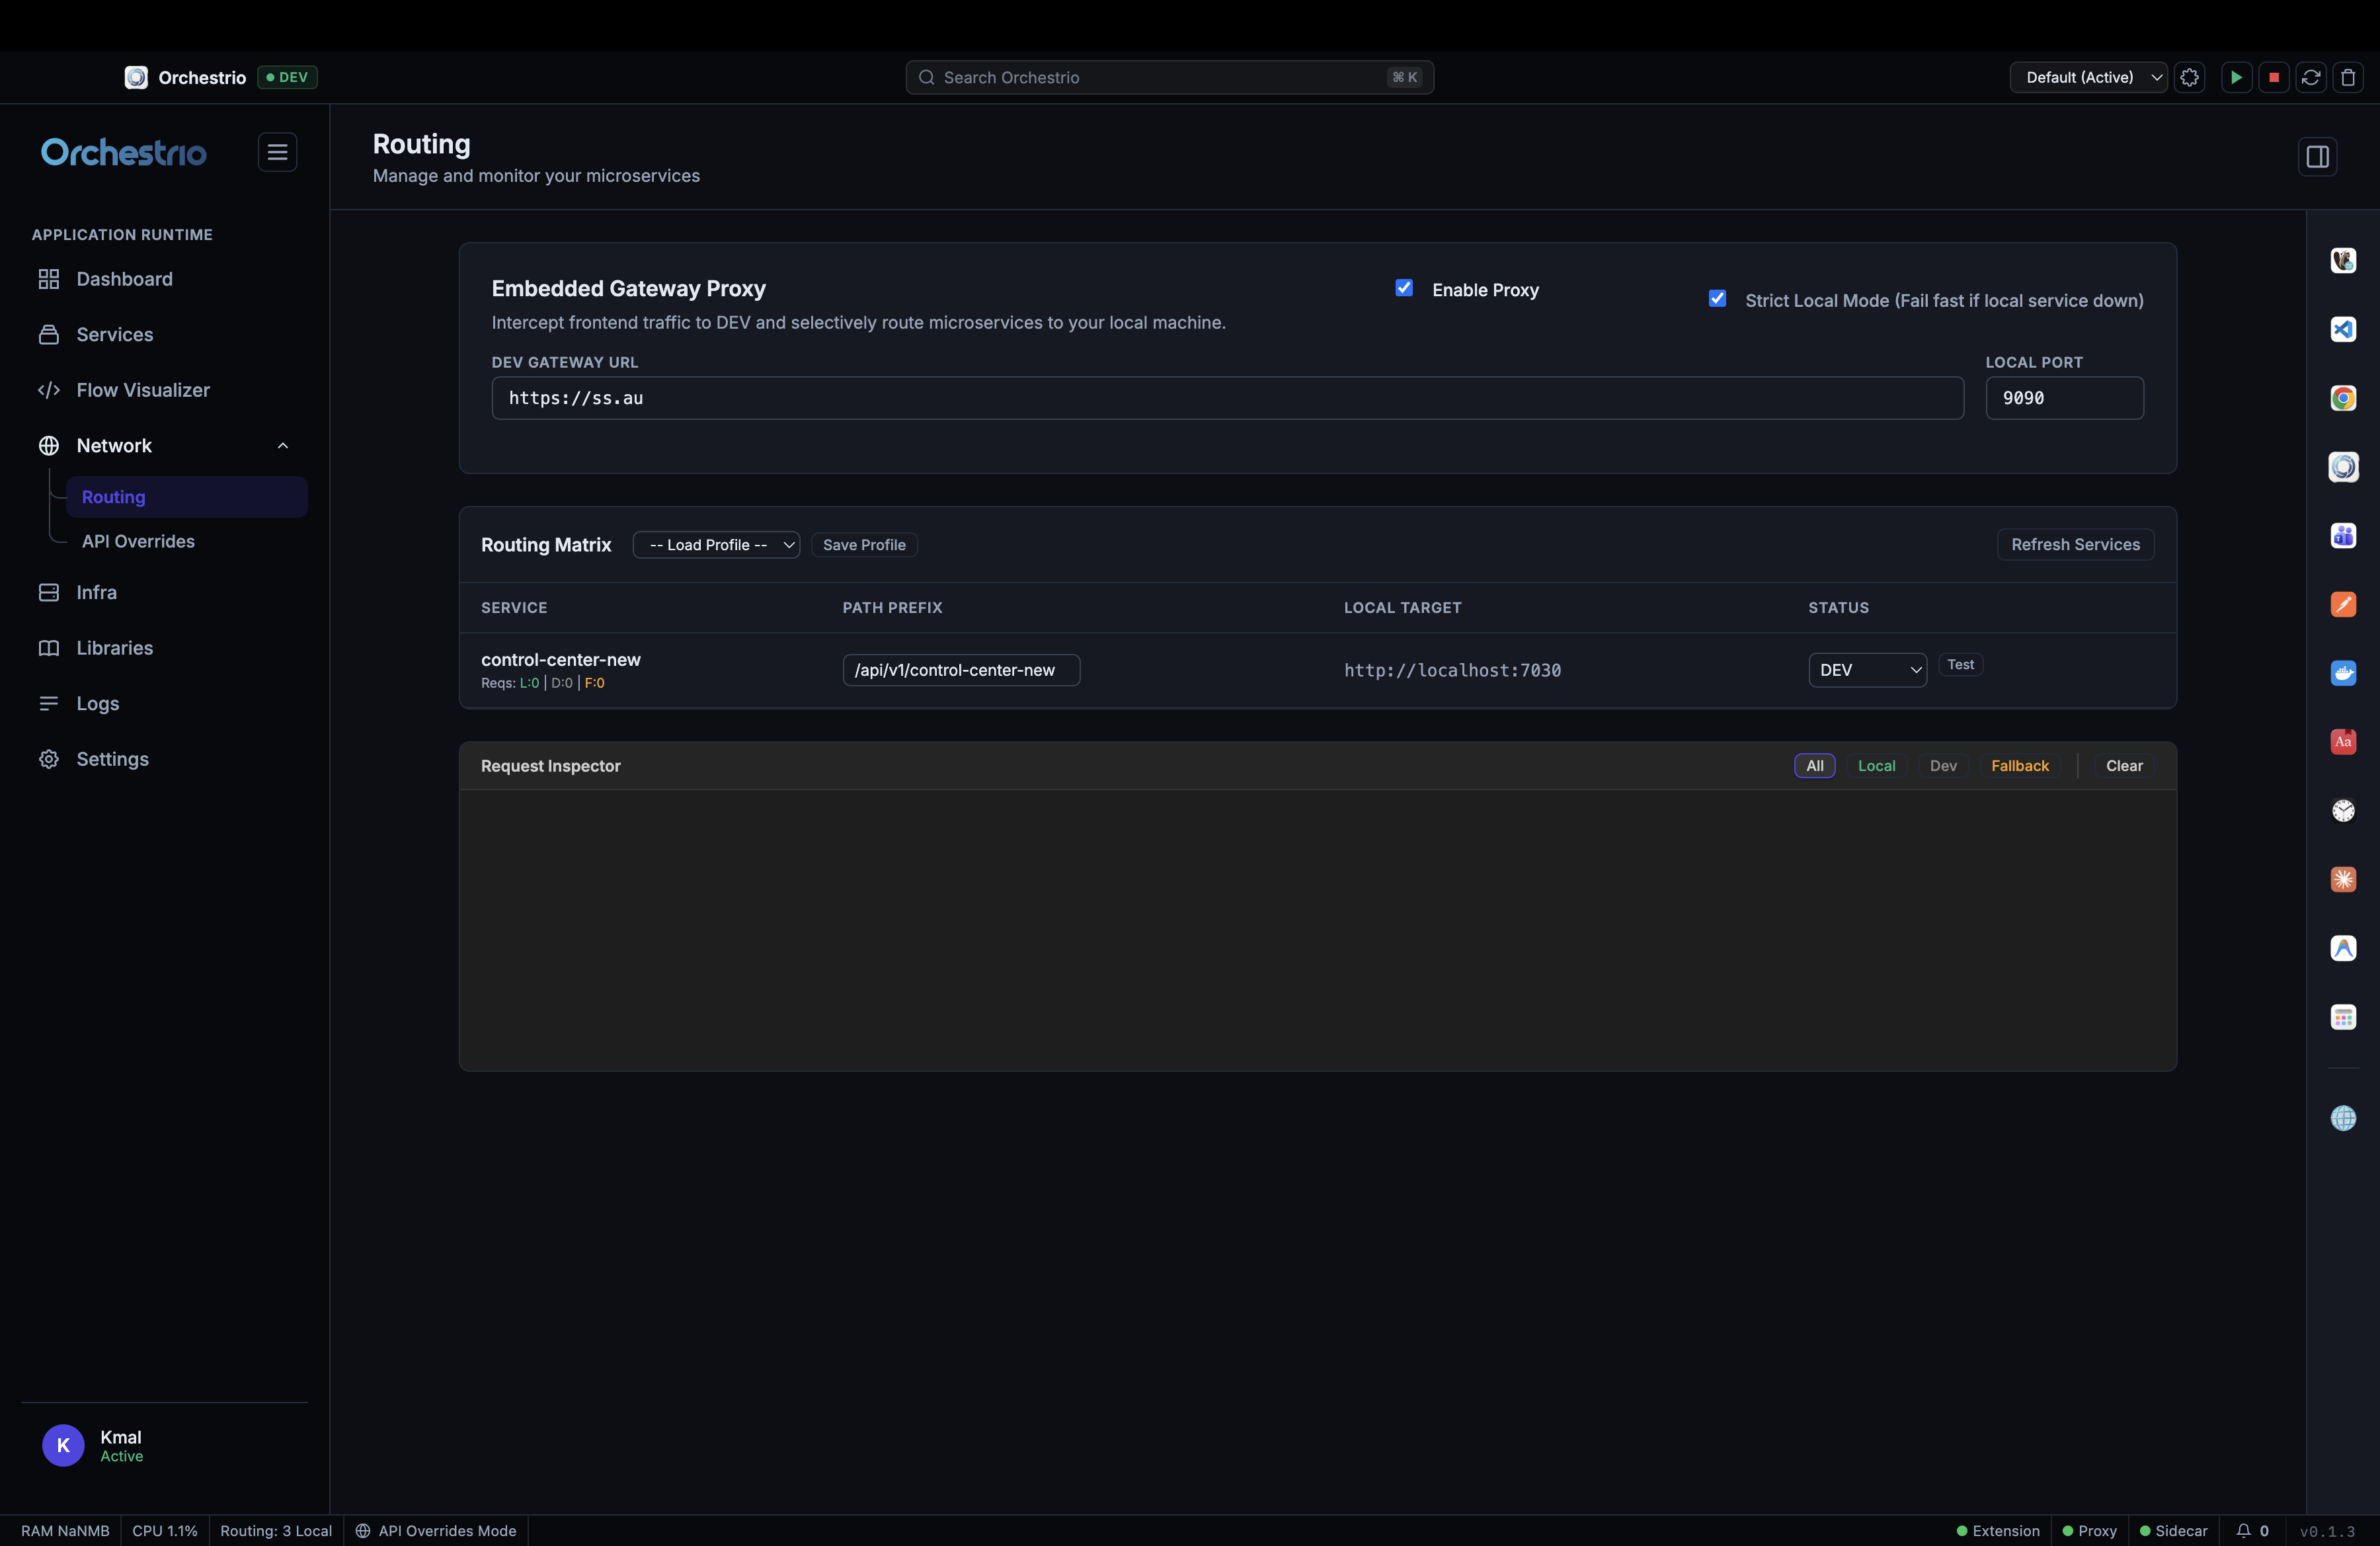
An embedded Gateway Proxy intercepts your frontend traffic and routes each microservice independently to LOCAL, DEV, QA, or UAT. Orchestrio regenerates Spring properties automatically. Capture payloads and inspect requests in real time without leaving the app.

Embedded Gateway Proxy Feign client override Auto YAML regen Routing profiles Request Inspector
Network routing panel with embedded gateway proxy, routing matrix and request inspector
03 · Flow Visualizer

See exactly how your services talk.

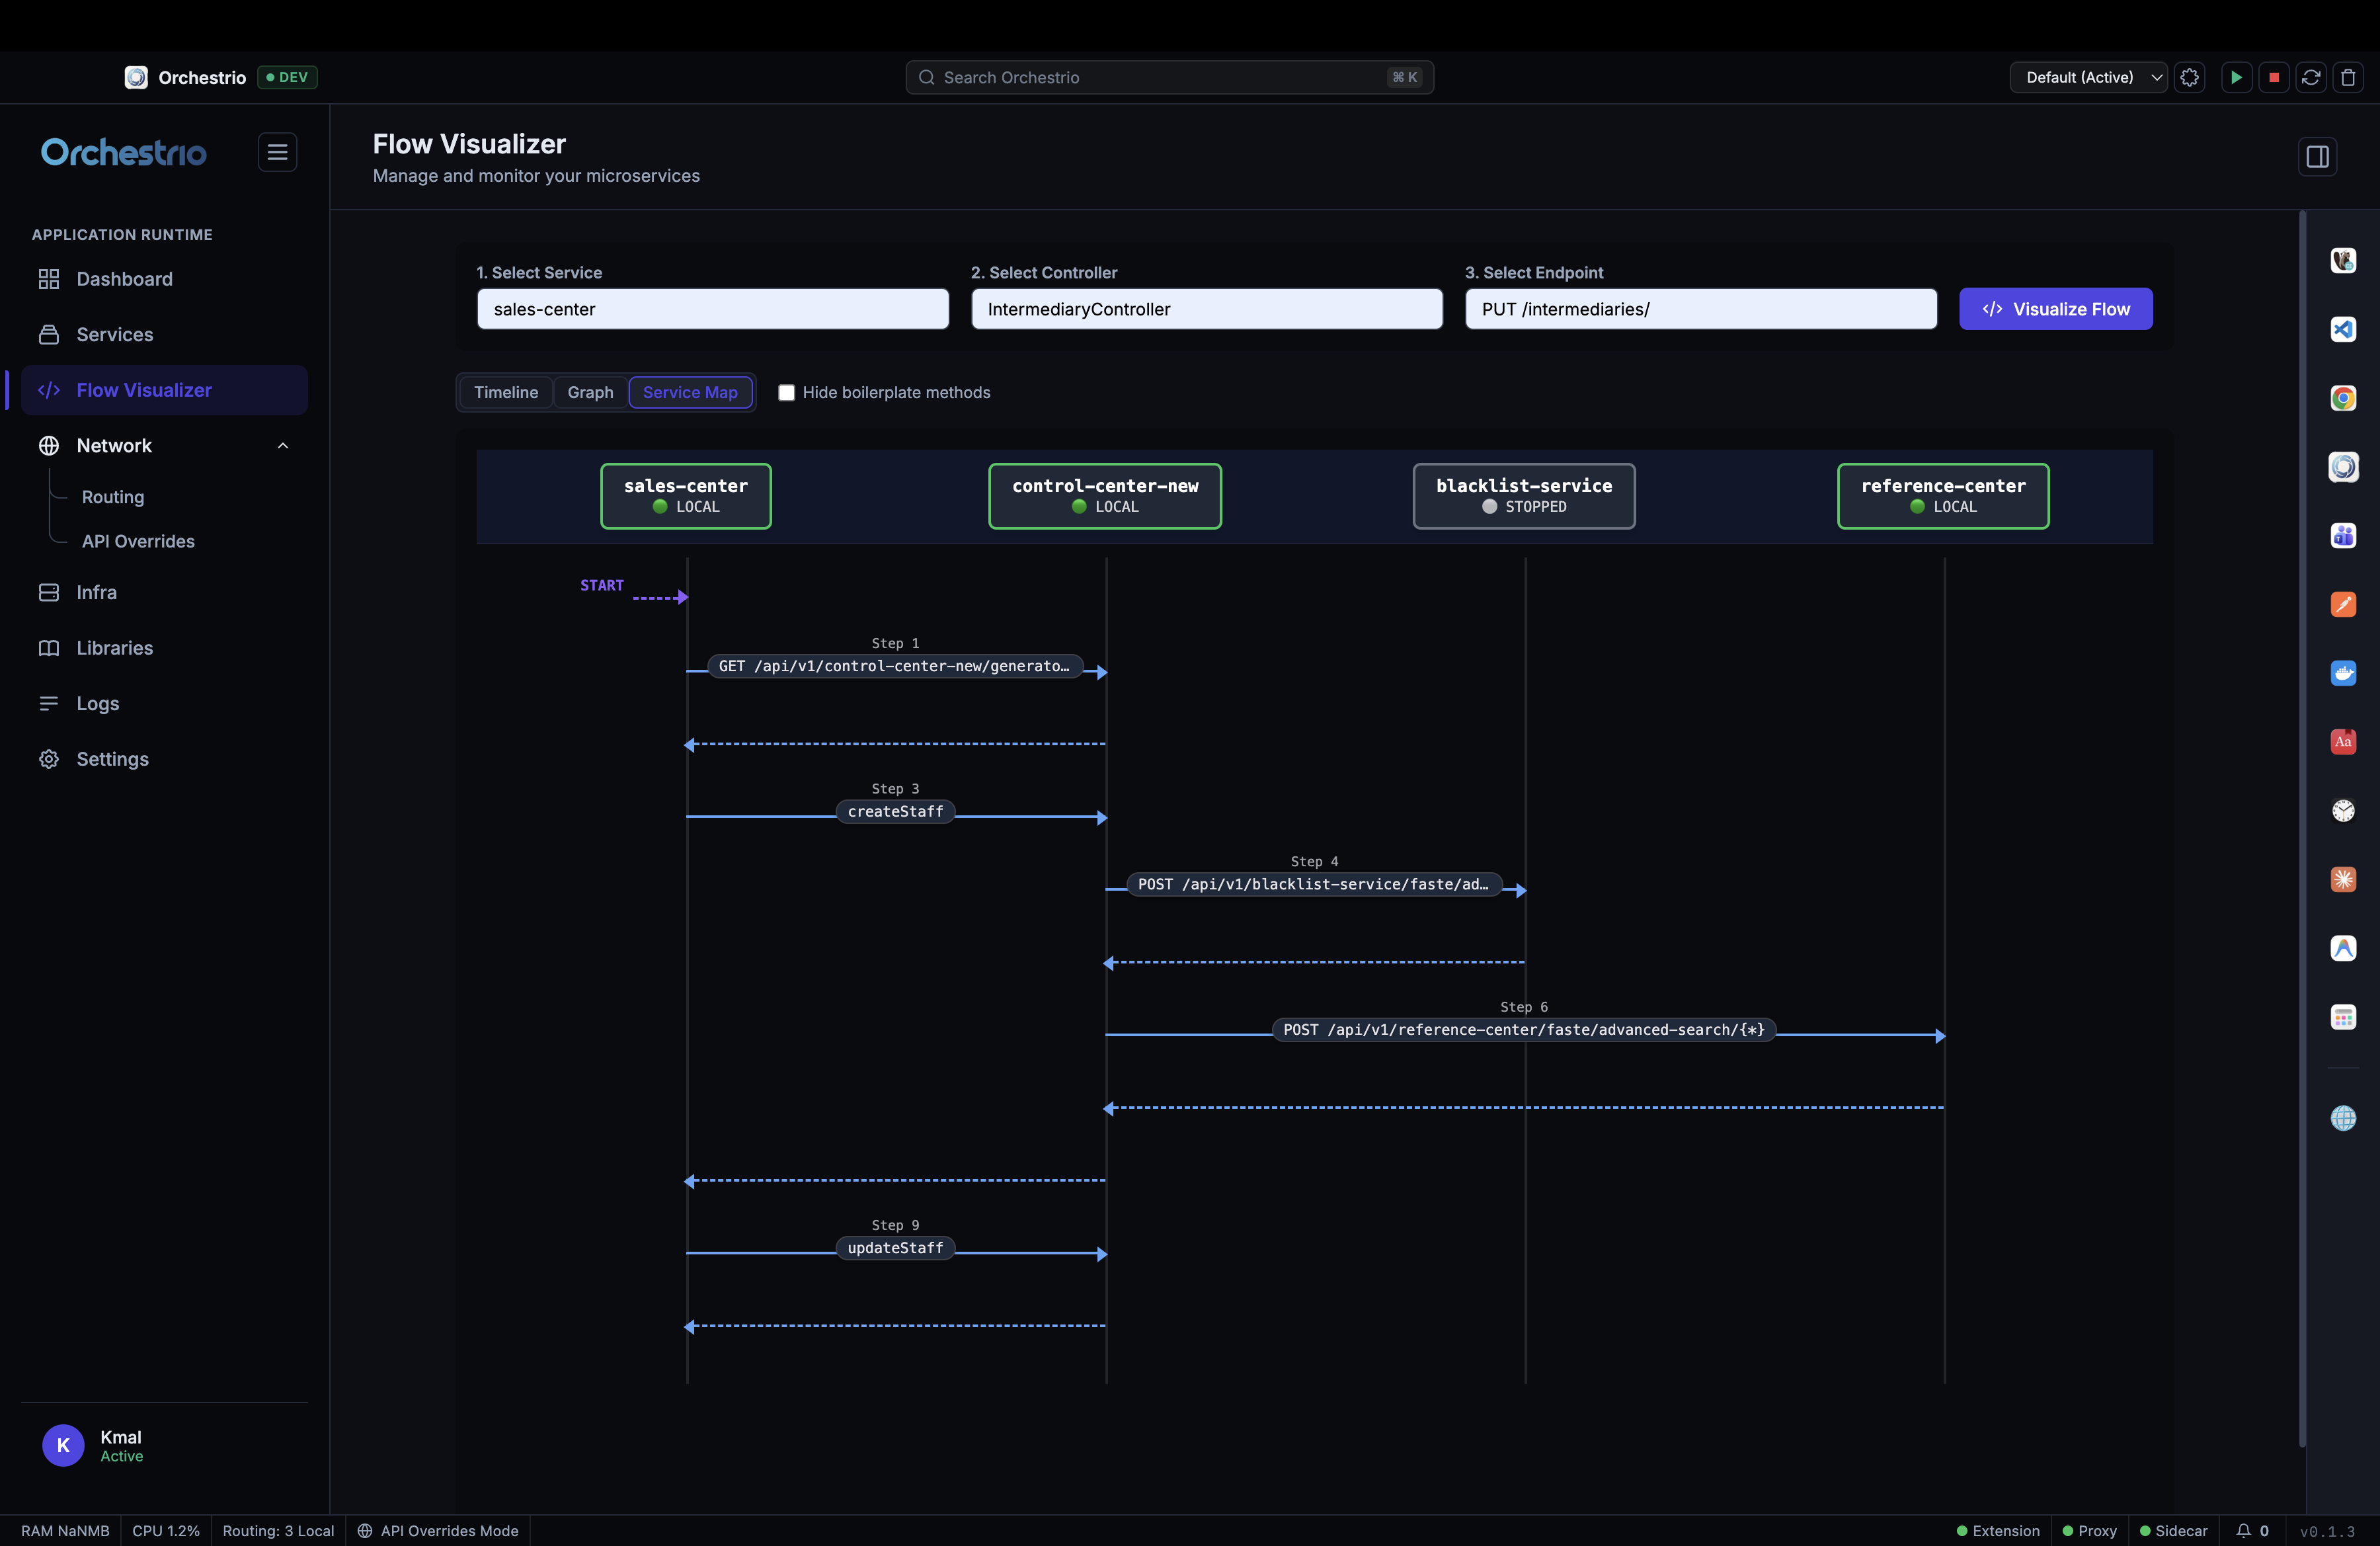
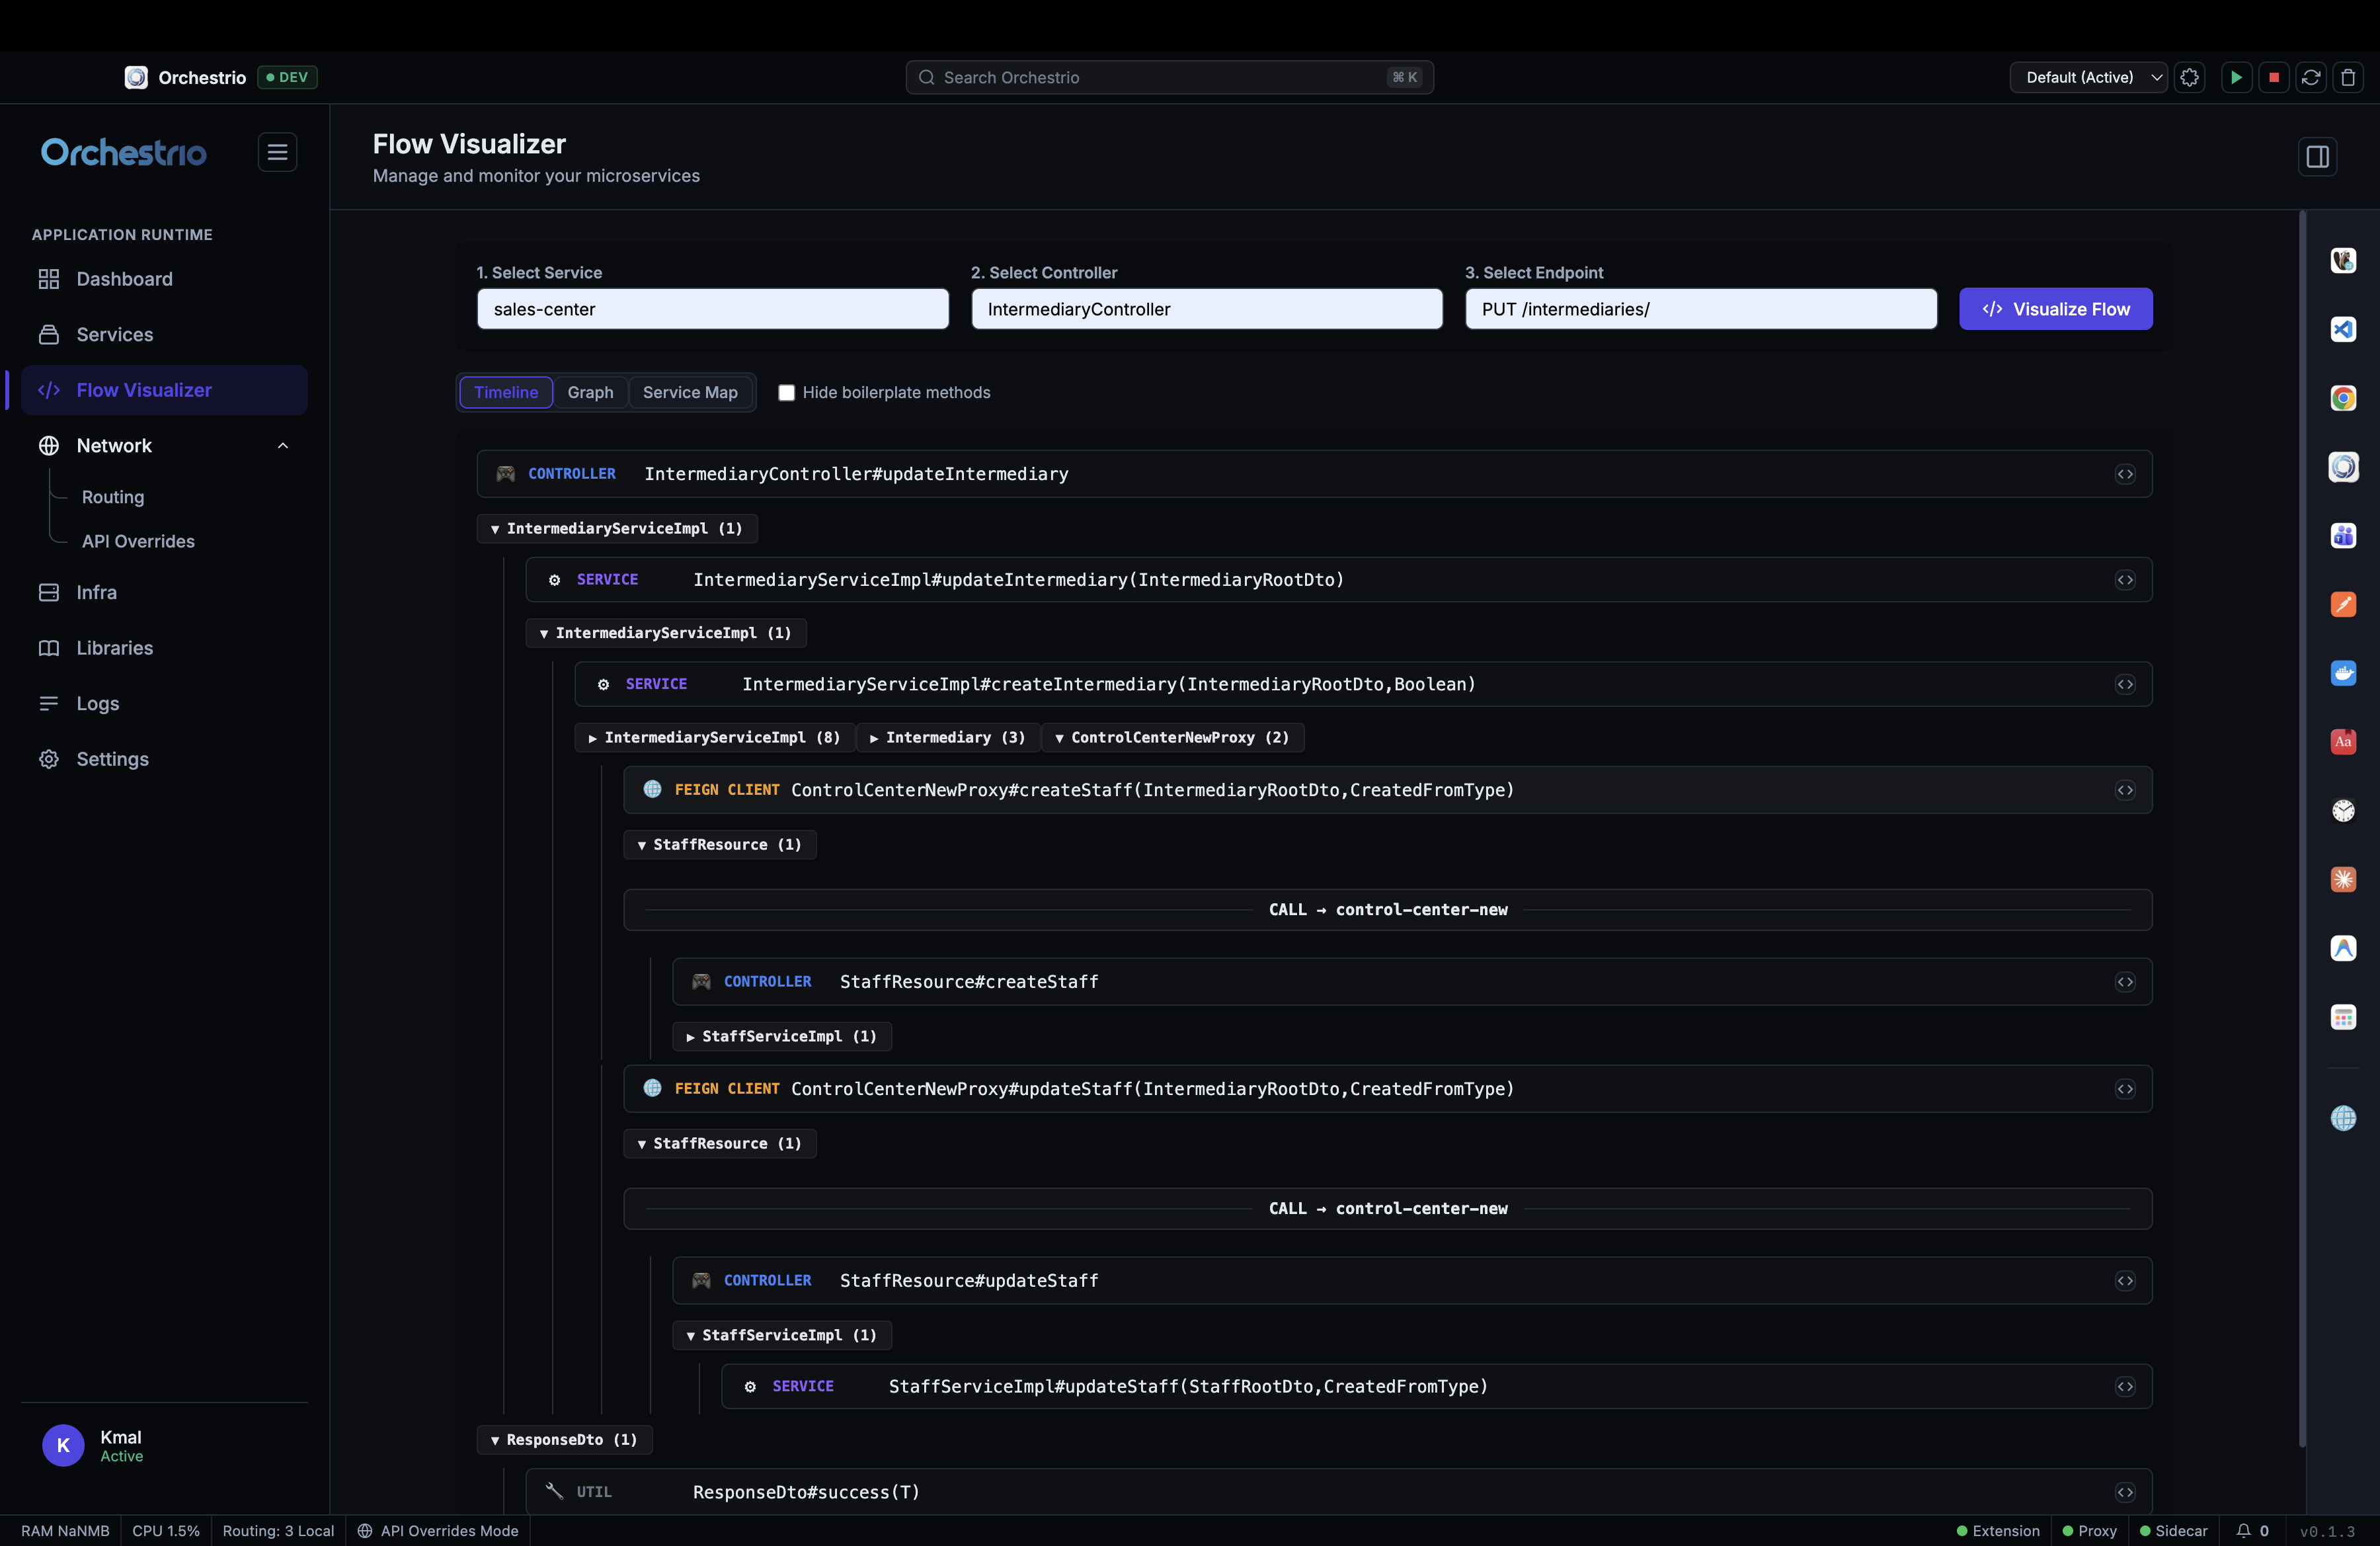
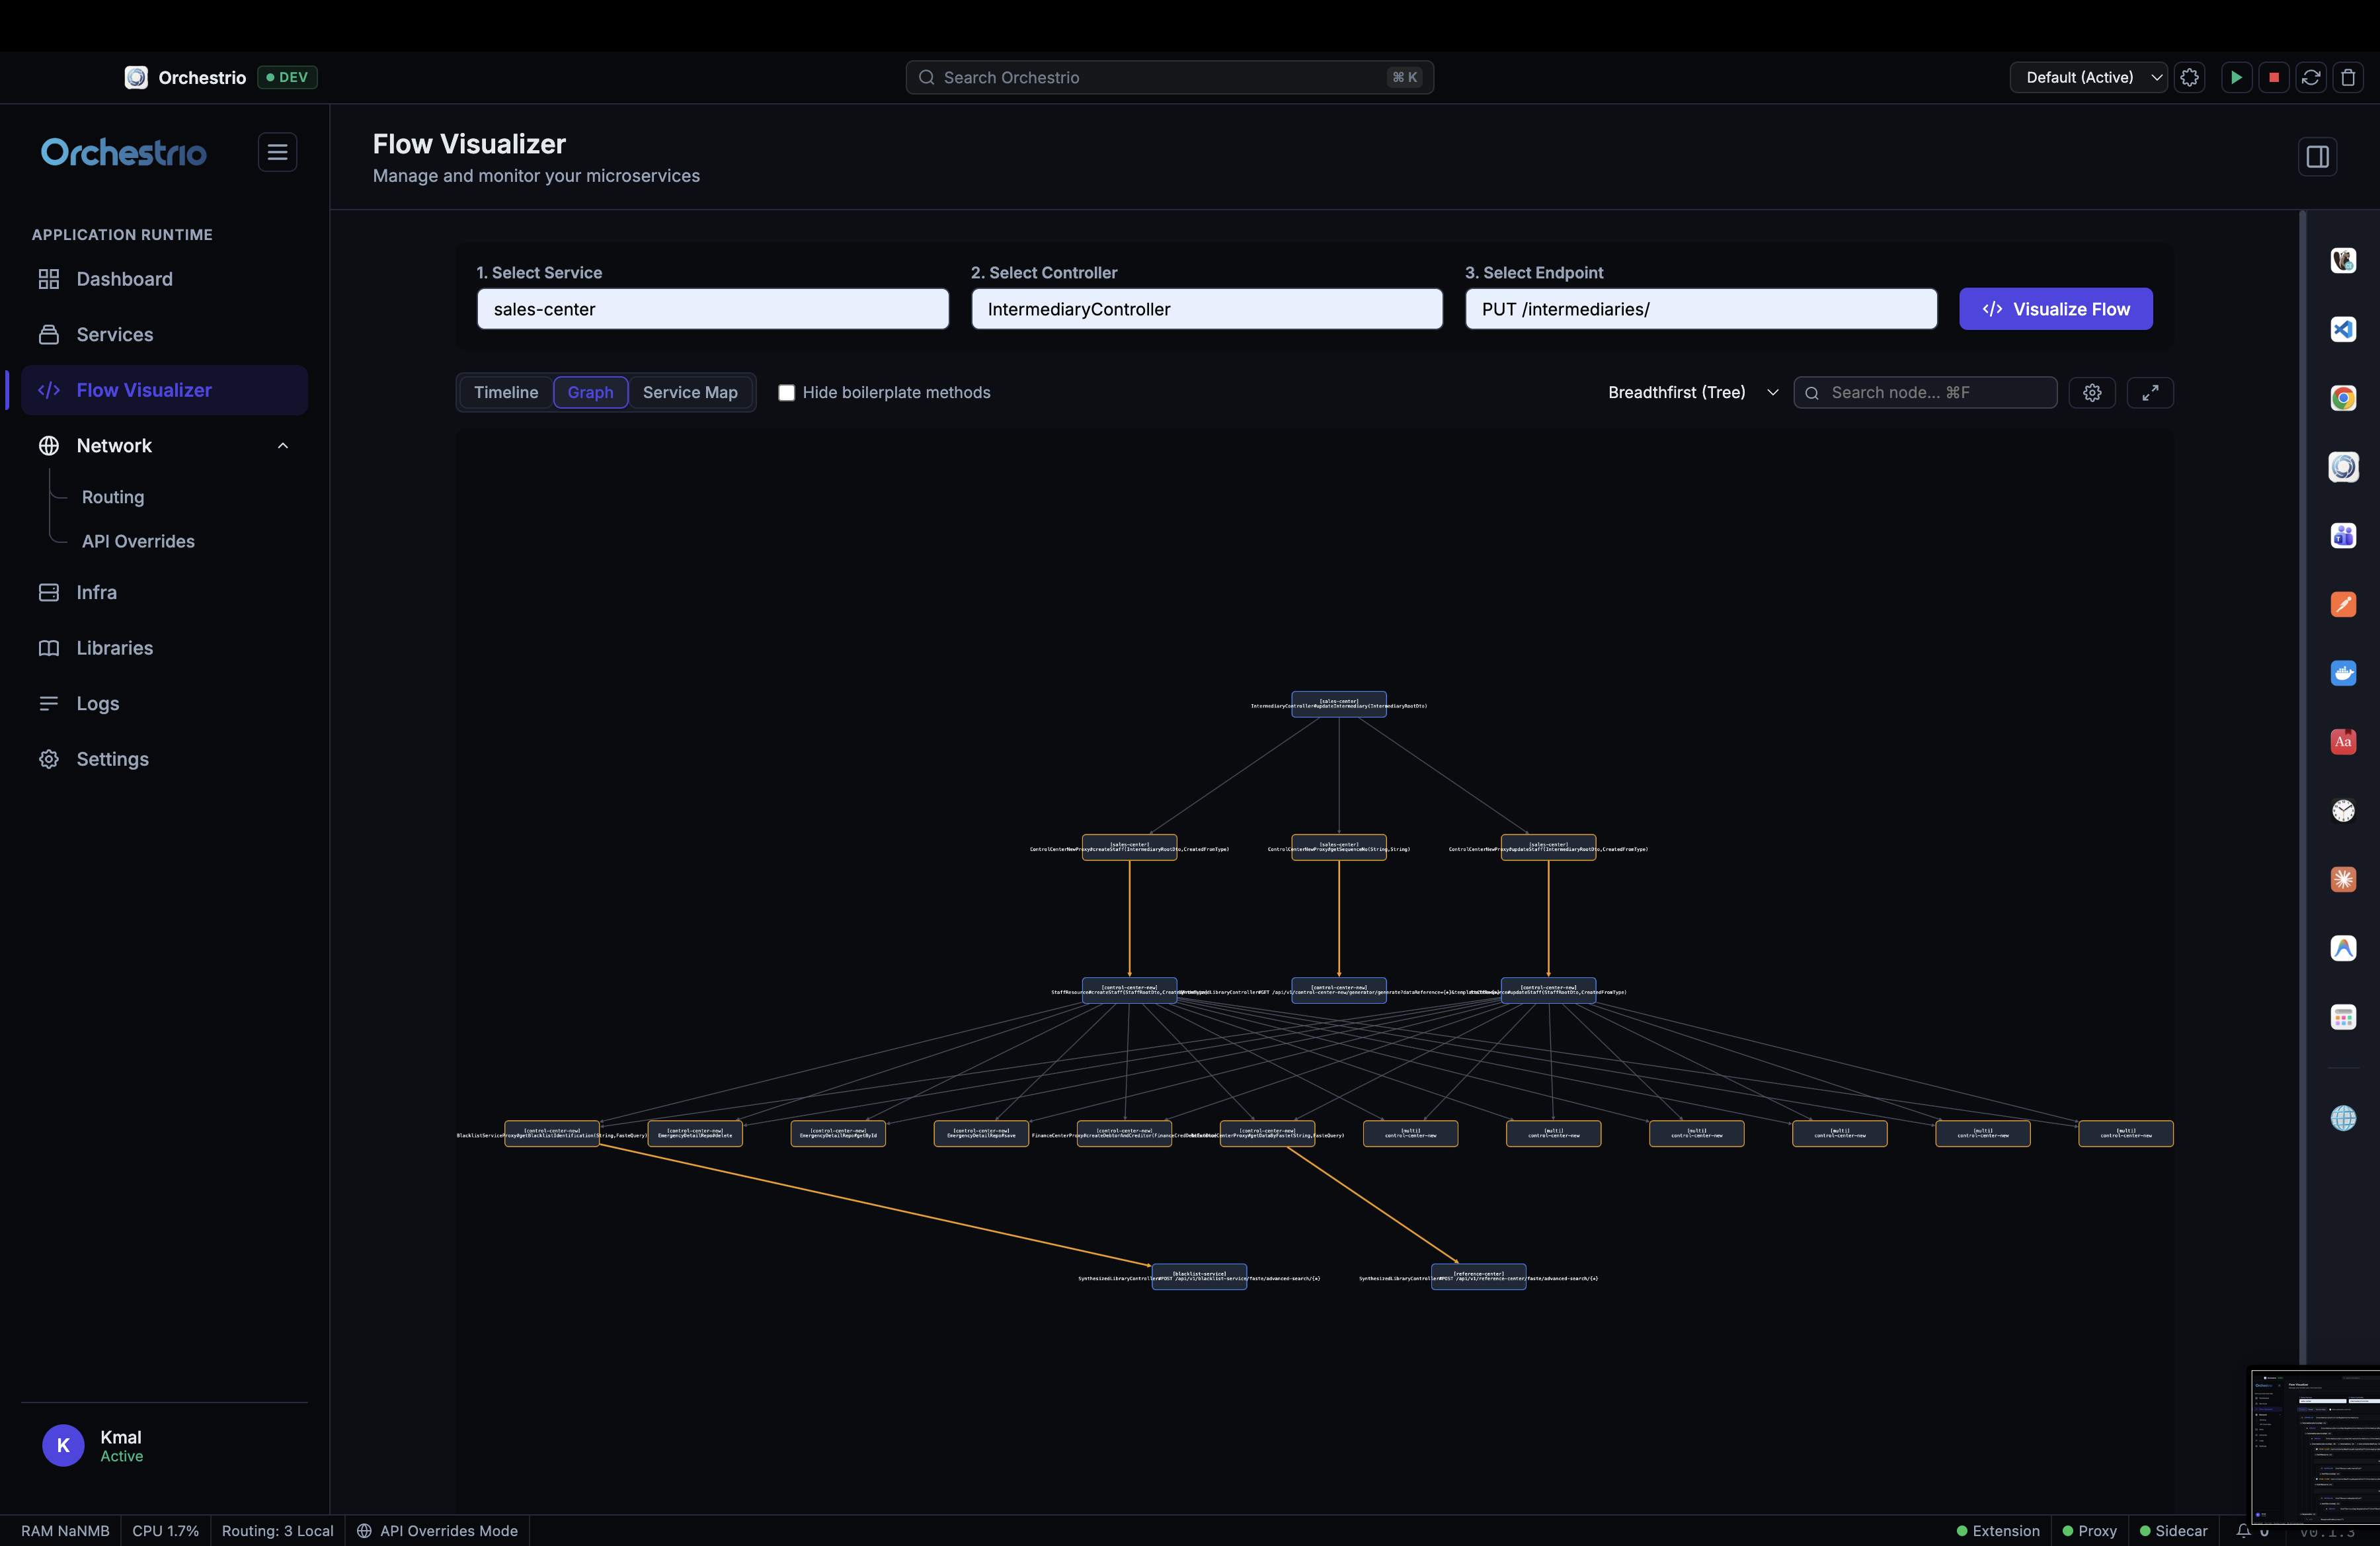
Pick a service, controller, and endpoint. Orchestrio traces the full call graph through your microservice mesh and renders it as a sequence diagram, timeline tree, or dependency graph. No more guessing which downstream call is slow or failing.

Flow Visualizer service map showing sequence diagram of cross-service calls
Flow Visualizer timeline showing controller, service and feign client call hierarchy
Flow Visualizer graph view showing breadth-first dependency tree
Sequence Map
Visual call flow across services
Timeline View
Controller → Service → Feign tree
Dependency Graph
Breadth-first call graph rendering
04 · API Overrides

Test local APIs from your browser.
Without CORS hell.

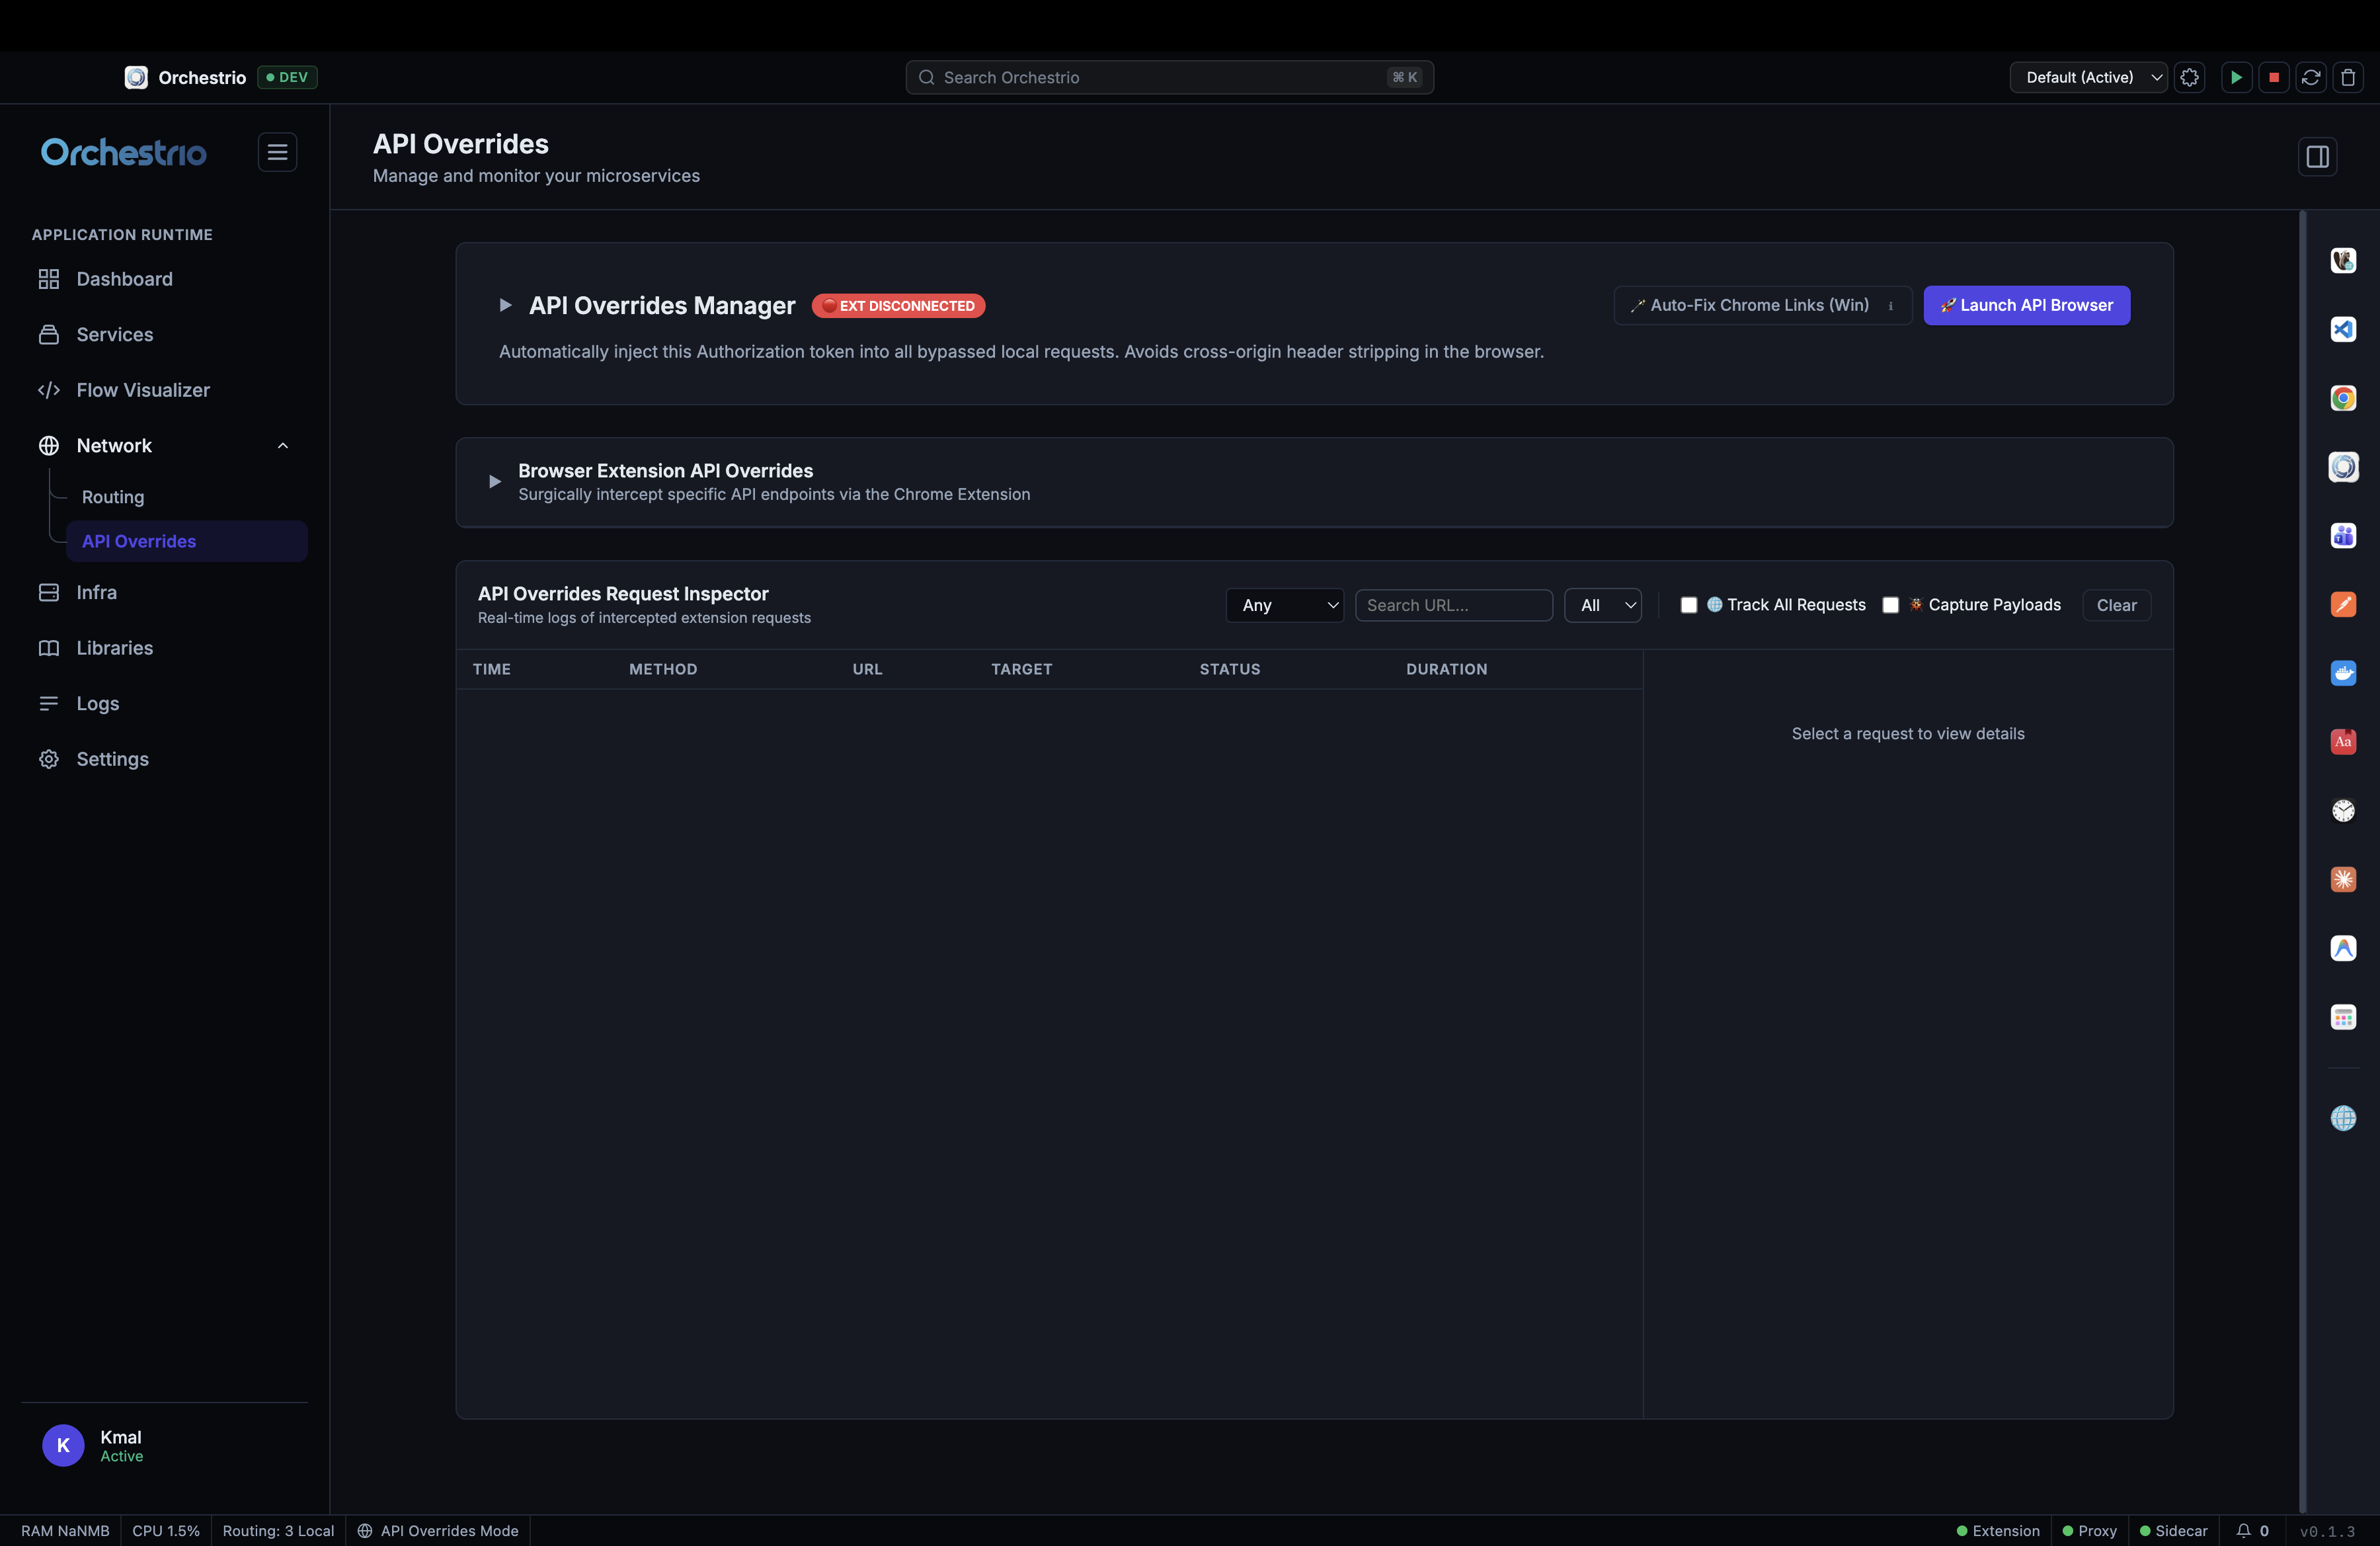
A bundled Chrome Extension surgically intercepts requests to specific API endpoints and injects your Authorization token automatically. No more CORS errors, no more stripped headers — test any endpoint from the browser as if you are already authenticated. The built-in Request Inspector captures every payload for analysis.

Chrome Extension bundled Auth token injection Request Inspector Payload capture API browser launcher
API Overrides panel with browser extension auth injection and request inspector
05 · Logs

Every service. One stream.

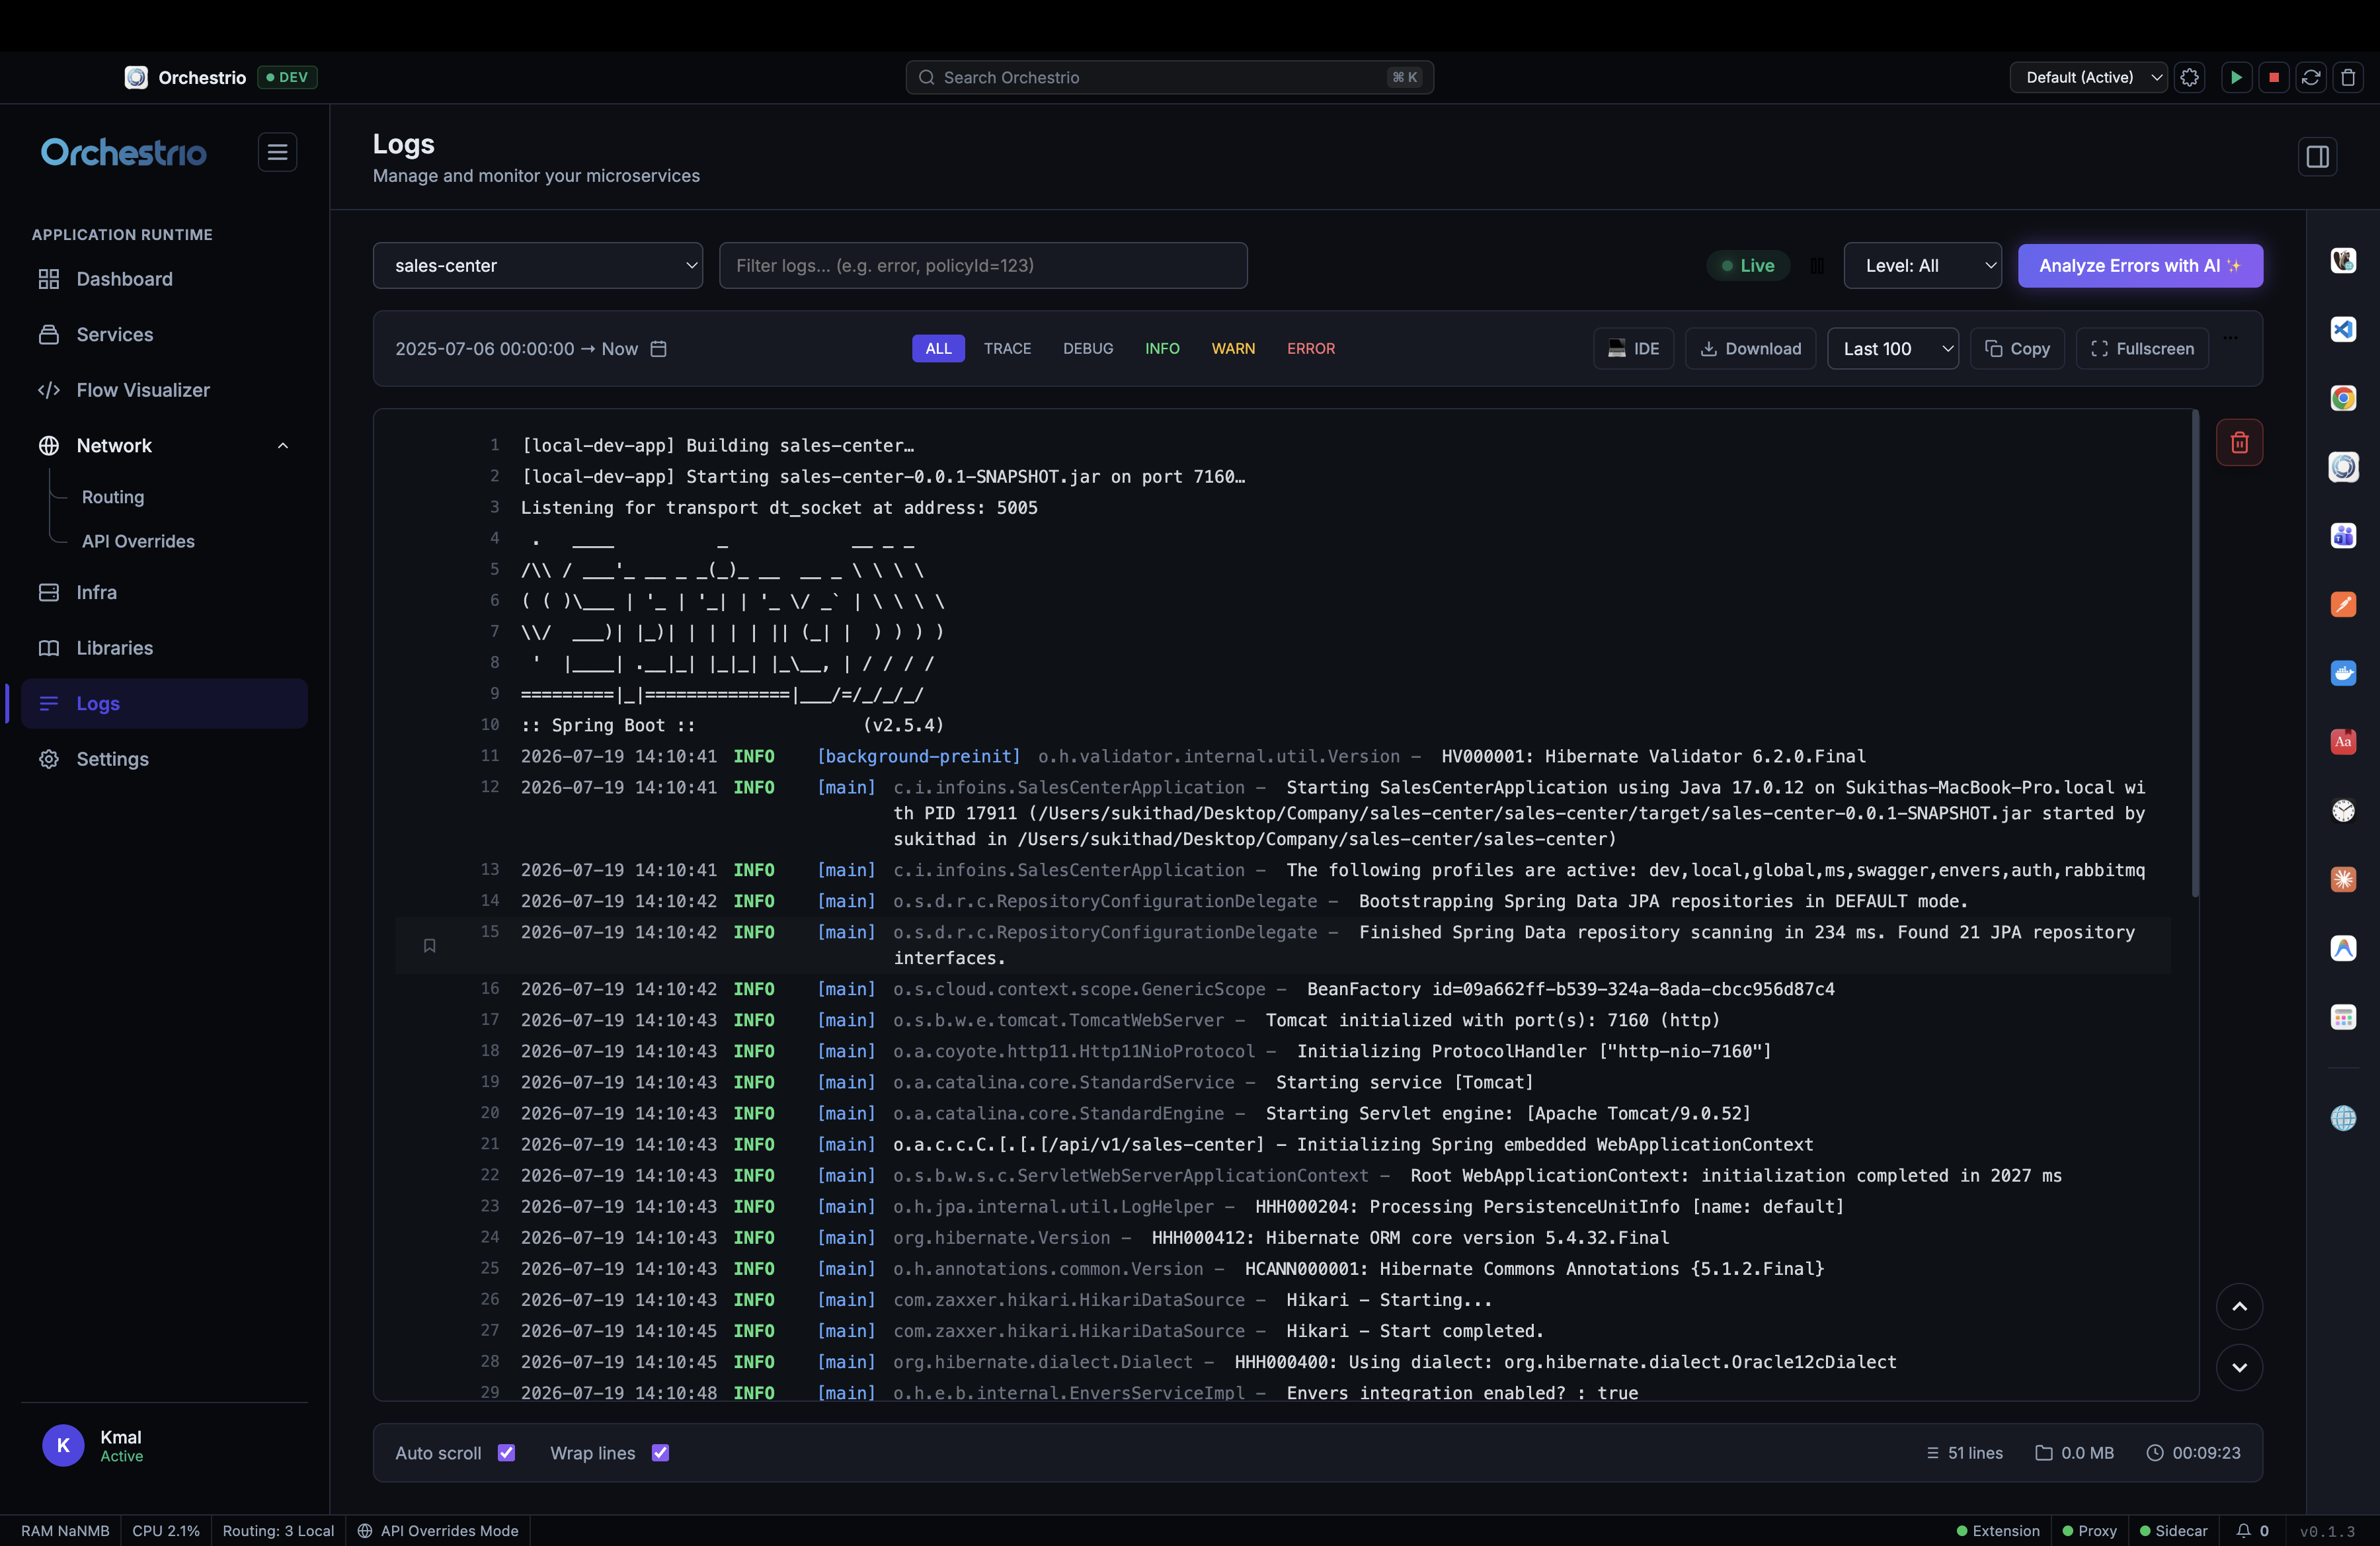
Watch every running service in one clean real-time log feed over Server-Sent Events. Filter by level, search full text, and jump to source. Hit Analyze Errors with AI for an instant root-cause summary.

Live SSE stream Level filtering Full-text search AI error analysis Auto-scroll Download logs
Live log stream for sales-center with INFO, WARN and ERROR filtering and AI analysis button
Quick start

From install to first running service.

Four steps. That is it.

Step 01

Install & pick a workspace

Grab the .dmg or .exe and open Orchestrio. On first launch, choose a root folder where your Git repos will live.

macOS only If macOS blocks the app, run this in Terminal then reopen: xattr -cr /Applications/Orchestrio.app
Step 02

Bring infrastructure online

Point the Infra tab at your docker-compose.infra.yml. Orchestrio parses it and starts every container with one click.

Step 03

Add and run your services

In Services, add a Git URL, port, and dependencies. Missing code gets cloned automatically. Press play.

Step 04

Visualize, route & debug

Use Flow Visualizer to trace calls, Routing to switch environments, and AI Logs to catch failures instantly.

Under the hood

A desktop shell.
A local control plane.

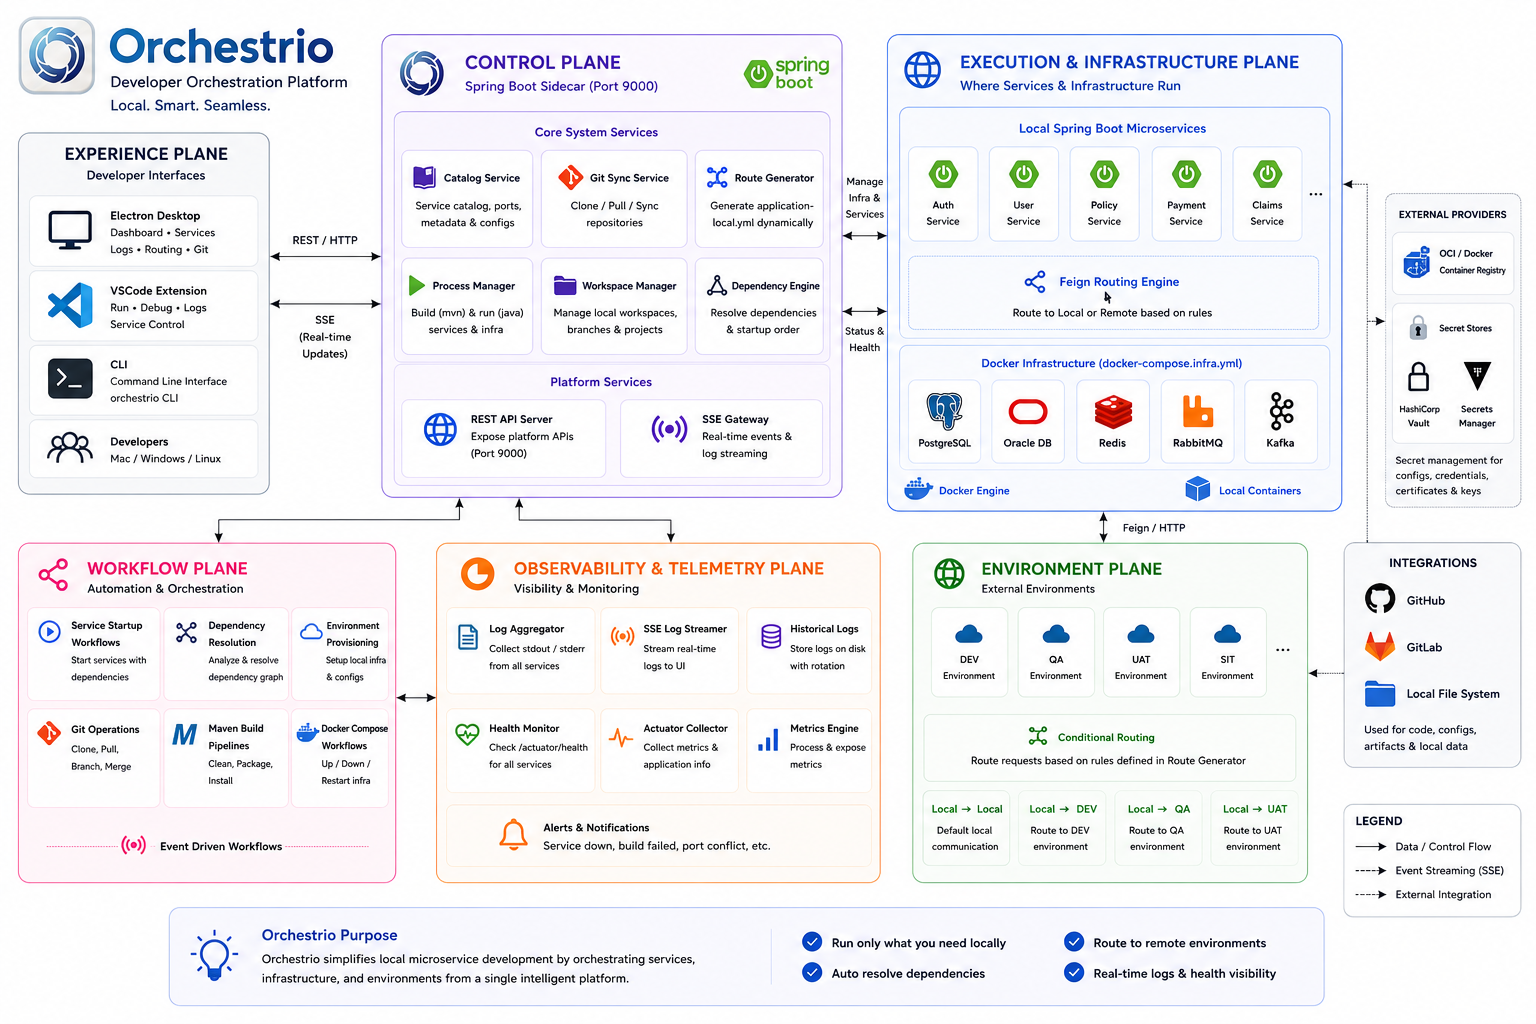
Orchestrio architecture overview showing Experience, Control, Execution, Infrastructure, Workflow and Observability planes
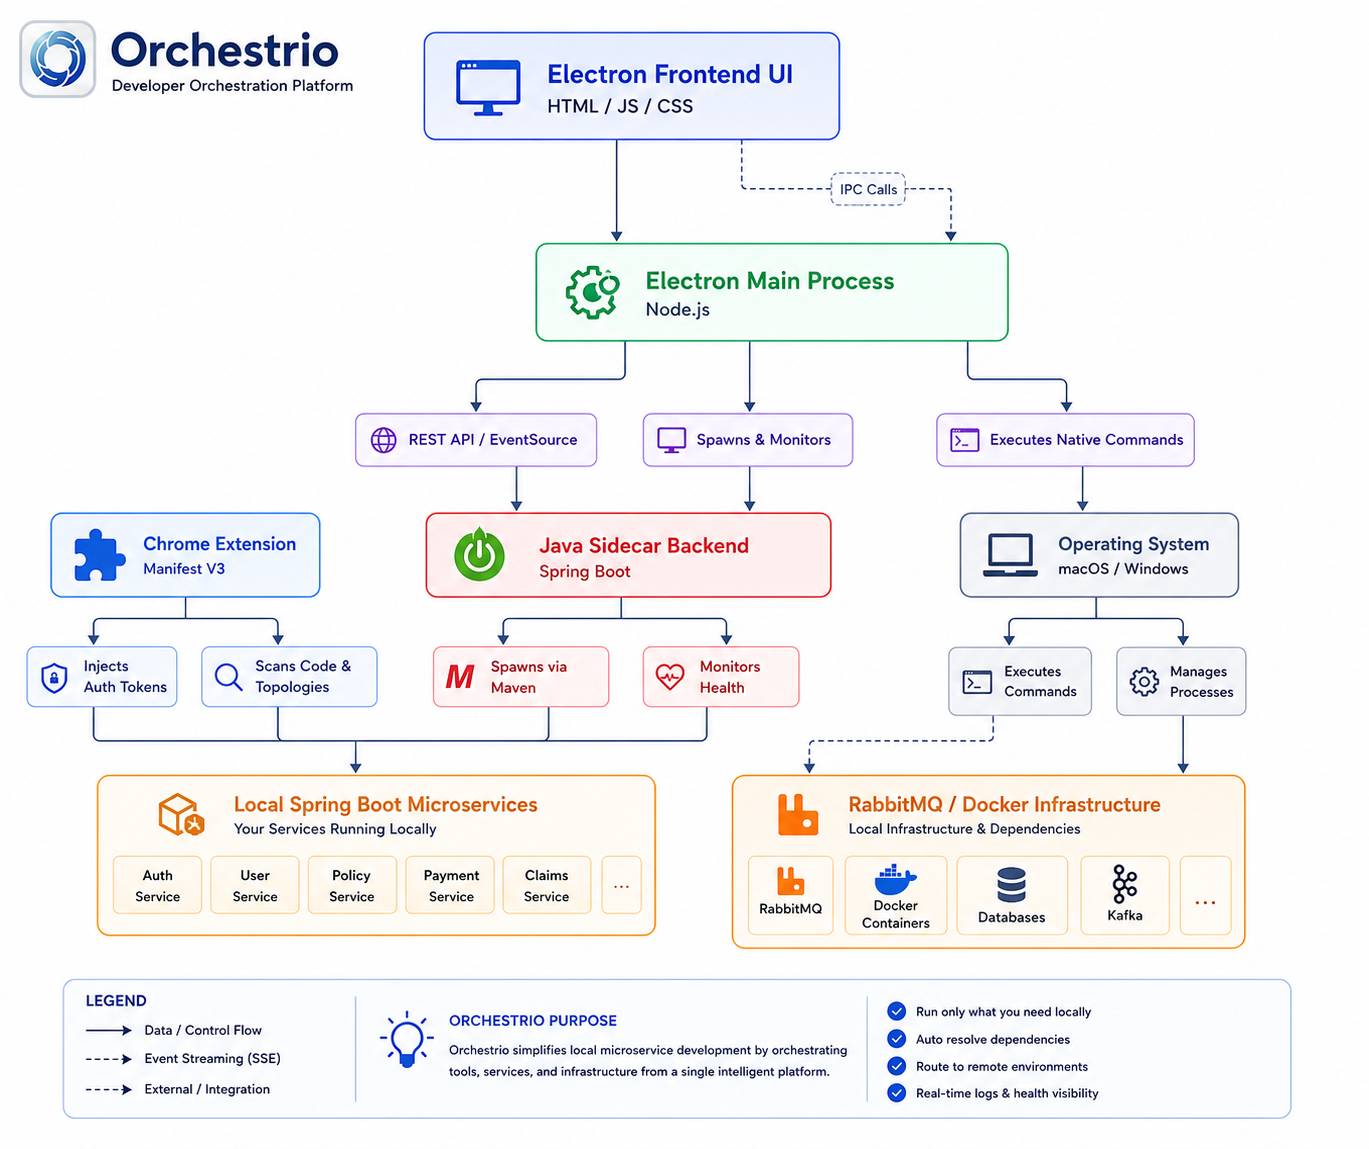
Orchestrio detailed architecture diagram showing Electron Frontend UI, Electron Main Process, Java Sidecar Backend, Chrome Extension, and local microservices infrastructure

The Electron desktop app talks over REST and SSE to a local Control Plane — a Spring Boot sidecar on port 9000 that manages your service catalog, Git sync, dependency resolution, and routing rules. A bundled Chrome Extension handles auth injection for browser-based API testing. Nothing leaves your machine.

Release history

What has shipped.

Fetching release history...
Privacy & security

Nothing leaves your machine.

No telemetry

Orchestrio does not phone home. There are no cloud accounts and no usage tracking — the app only talks to your local sidecar.

Local by design

Git credentials, source code, and infrastructure data stay exclusively between your Electron app and your local control plane.

Yours to inspect

Workspaces are isolated per project, and every generated config file lives right in your repo where you can read it.

Orchestrio app icon

Give your local environment
a conductor.

Free, native, and entirely on your machine. Available for macOS (Apple Silicon & Intel) and Windows x64.

Fetching latest version...
Apple Silicon · Intel · Windows x64  ·  Zero cloud accounts
macOS tip If macOS blocks launch after install, open Terminal and run: xattr -cr /Applications/Orchestrio.app Then open Orchestrio again.